next up previous
Next: Bibliography Up: An example of dose Previous: Running the example

Analyzing the results

The independent outputs of the USRBIN scoring (unfortmatted output on unit 23, in the present example) from the different FLUKA runs must be summed together using the program usbsuw.f:
#!/bin/sh
$FLUTIL/usbsuw <<EOF
gasbrem001_fort.23
gasbrem002_fort.23
gasbrem003_fort.23
gasbrem004_fort.23
gasbrem005_fort.23
gasbrem006_fort.23
gasbrem9007_fort.23
gasbrem0008_fort.23
gasbrem0009_fort.23
gasbrem0010_fort.23

gasbr
EOF

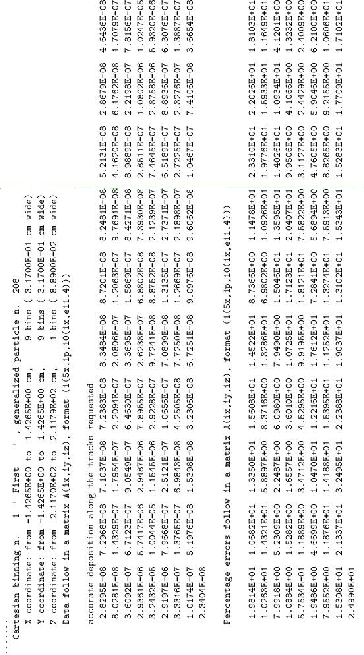
This program (usbsuw) may be modified by the user to insert possible calls to invoke (or prepare input for) graphic routines. In any case a formatted output is by default available (gasbr_sum.lis), where the user can find a table like the one of Fig.1.

Figure 1: Part of the formatted output from the use of usbsuw.f
\begin{figure}\begin{center}
\mbox{\epsfig{file=output.eps,height=15cm}}
\end{center}\end{figure}

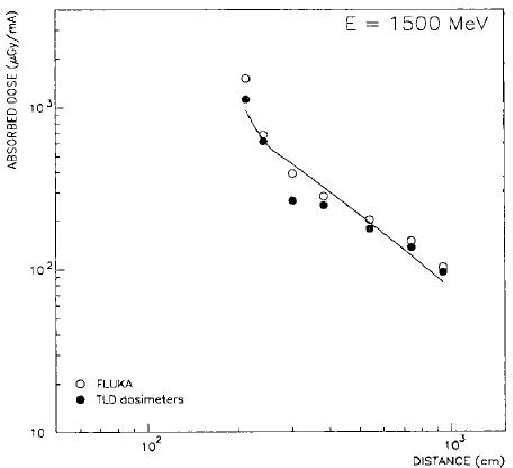
As a conclusion, we report in Fig.2 a plot obtained in ref.[1] using the described input.

Figure 2: Maximum absorbed dose per mA of beam lost as a function of the distance from the ened of the straight section
\begin{figure}\begin{center}
\mbox{\epsfig{file=figfin.eps,width=12cm}}
\end{center}\end{figure}


Giuseppe Battistoni 2003-05-07